Conversion Rate Optimization in eCommerce: The Biggest Levers in Your Existing Store
Conversion rate optimization (CRO) is the systematic process of increasing the share of store visitors who buy, without paying for more traffic. The biggest proven levers are changes to checkout, load time, mobile experience and trust signals. Their prerequisite is reliable measurement: whoever optimizes on incomplete data optimizes on an incomplete picture.

Work with online stores reveals a recurring pattern: when growth stalls, the first look almost always goes to the advertising, rarely to the store itself. Yet the closer reserve usually waits exactly there, unglamorous, in the checkout, in the load time, in three form fields too many, in the places where visitors silently drop off today. Whoever starts there grows out of the traffic they have long since paid for.
The essentials at a glance: The most effective levers sit in the existing store. The proven points and their magnitude:
- Reliable measurement as a prerequisite: If part of the conversions is missing from tracking, every optimization leads astray, which is why the data foundation comes first.
- Checkout and cart abandonment: Around 70 percent of carts are abandoned; the most common fixable reasons are extra costs that are too high, lack of trust and a checkout that is too long. The single biggest lever.
- Load time: Just 0.1 seconds faster mobile load time was associated with 8.4 percent more conversions in a Google/Deloitte study.
- Mobile optimization: Around three quarters of sessions come from mobile devices, but they convert worse than desktop; the gap is biggest on mobile.
- The margin effect: With the same traffic, revenue grows in proportion to the conversion rate, and the additional revenue falls disproportionately into the margin.
What is the conversion rate, and how do you calculate it?
The conversion rate is the share of visitors who complete a desired action, in an online store a purchase. It is calculated as conversions divided by sessions, multiplied by 100, and is stated as a percentage. An example: 40 purchases from 2,000 sessions equal a conversion rate of 2 percent.
The reference base matters. Dividing by sessions produces a different value than dividing by individual visitors, because the same person can have several sessions. Benchmarks are only comparable if they use the same reference base.
What is a good conversion rate in an online store?
In eCommerce, the average conversion rate is around 2 to 3 percent depending on the source. The aggregated panel from Dynamic Yield reports an overall value of 2.9 percent, 2.8 percent on mobile and 3.2 percent on desktop [1]. What counts as “good” is always relative to industry, device, country and product range; a single benchmark is only a reference point.
Common misconception: A good store should convert at 8 to 10 percent or more. What the data shows is a global average in the low single digits. That is normal.
These values come from a panel of more than 400 brands with more than 200 million monthly users. Large, well-known brands tend to pull the average up. What is reliable is therefore the order of magnitude, not the individual percentage as a decimal-point truth. An Austria-specific benchmark from a primary source is not available.
Why measurement comes before everything: you only optimize as well as your data
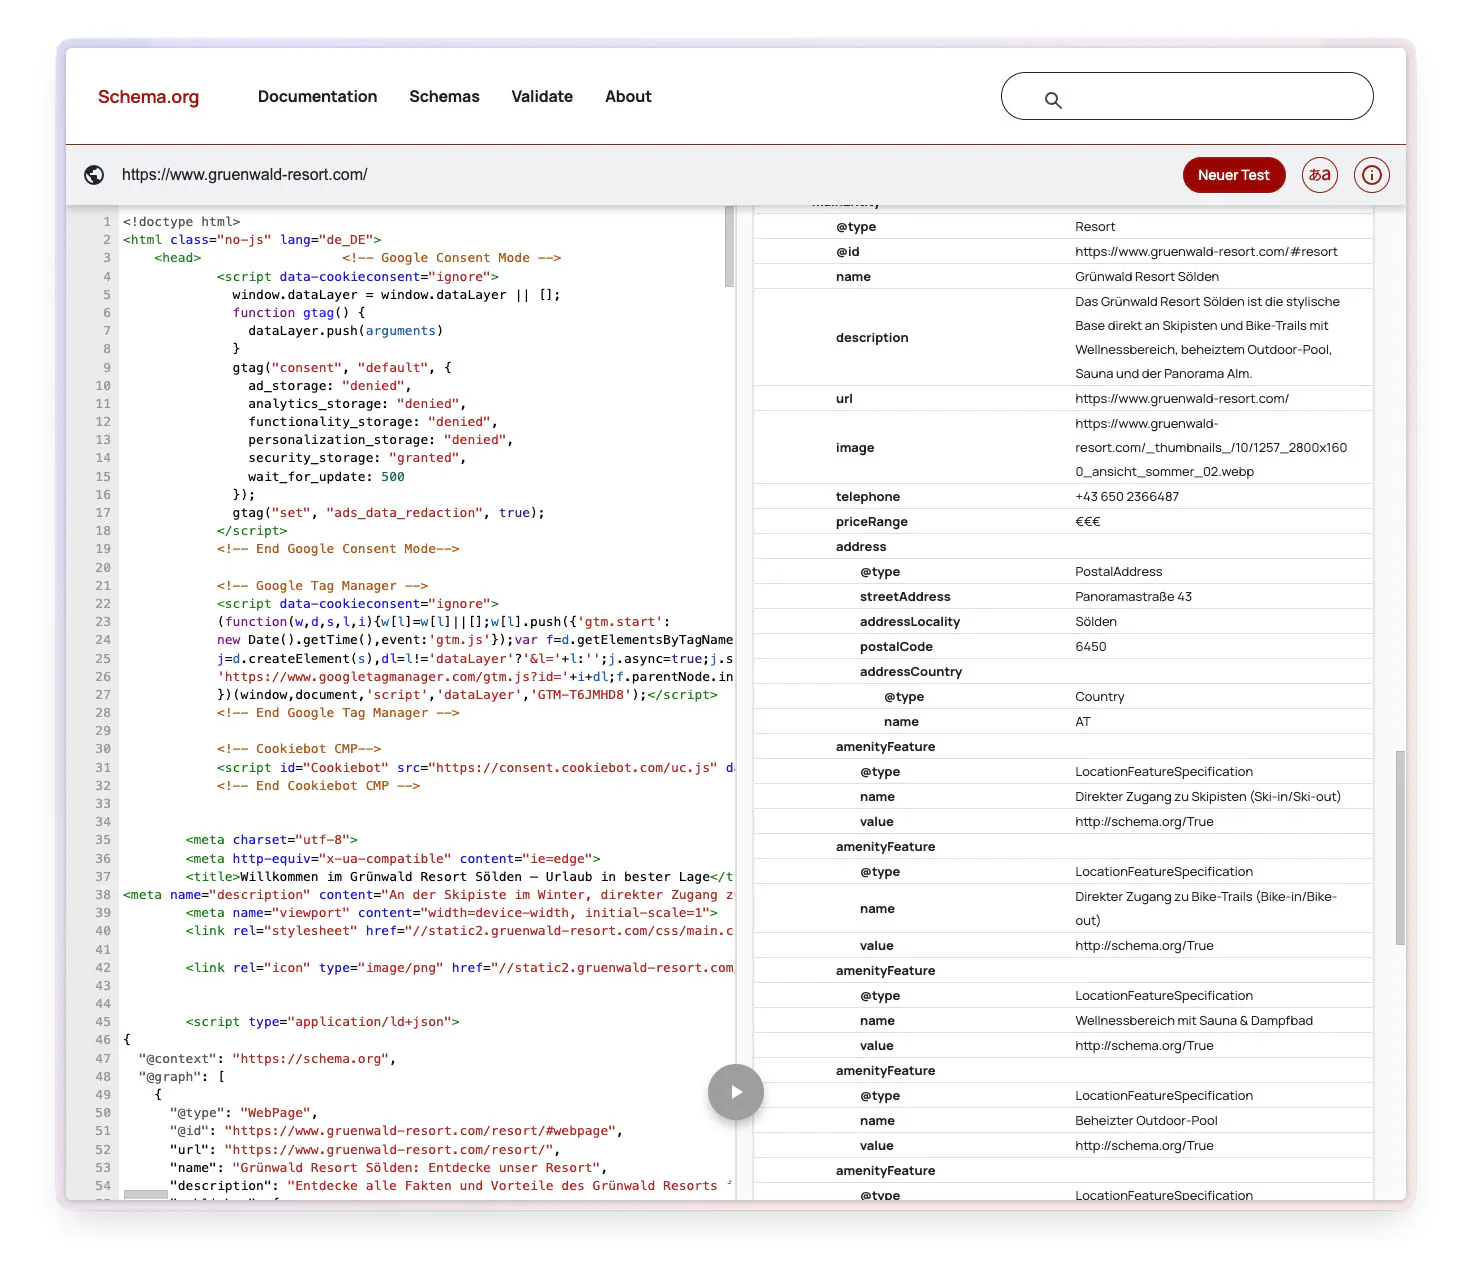
Before you optimize the conversion rate, the measurement has to be right. If part of the conversions is missing from tracking, the metrics come out too low and comparisons become distorted. Several mechanisms are responsible: Intelligent Tracking Prevention (ITP) in Safari, App Tracking Transparency (ATT) on iOS, cookies blocked or not set due to the GDPR consent prompt, and ad blockers. ITP and ATT are Apple mechanisms that restrict tracking cookies and advertising IDs.
Purely client-side measurement, meaning exclusively via a counting script in the browser (pixel), loses part of the conversions as a result. How large this loss is differs from store to store and can only be measured, not stated as a blanket figure. Server-side tracking, meaning measurement via your own server instead of the browser alone, closes part of this gap. The same foundation also decides how meaningful every A/B test is: if the measurement is wrong, every test “winner” is questionable too.
Optimizing on numbers you cannot trust is more dangerous than not optimizing at all, because it creates false certainty and steers budget in the wrong direction. That is why the first question is never which button to test, but whether the numbers hold up at all.
Common misconception: The dashboard shows numbers, so the measurement must be right. Client-side counting, however, does not capture every conversion. The foundation only becomes reliable once it is secured server-side, otherwise you optimize on a false picture.
The Conversions API is an interface through which conversions are reported from your own server instead of only from the browser, to close measurement gaps. How server-side tracking and this interface are set up in practice is covered in a dedicated guide.
Further reading: Setting up server-side tracking: the Dometrics guide
The biggest levers in the existing store, sorted by impact
The most effective levers are design and process changes. They build on what is already in place and can be tested step by step.
Checkout and cart abandonment: the single biggest lever
Around 70 percent of carts are abandoned; the Baymard average is 70.22 percent, calculated from 50 individual studies between 2006 and 2025 [2]. A large part is not fixable: 43 percent of surveyed online shoppers abandoned a cart because they were only browsing or not yet ready to buy [2]. What is fixable are the design- and process-related reasons at checkout.
The Baymard survey lists the following reasons for abandonment at checkout (multiple answers, “just browsing” excluded) [2]:
| Reason for abandonment at checkout | Share |
|---|---|
| Extra costs such as shipping, tax or fees too high | 39% |
| Delivery too slow | 21% |
| No trust when entering credit card details | 19% |
| Forced account creation | 19% |
| Checkout too long or too complicated | 18% |
| Unsatisfactory return policy | 15% |
| Website errors or crashes | 15% |
| Total costs not visible upfront | 14% |
| Too few payment methods | 10% |
This yields concrete adjustments: show costs early and transparently, offer a guest checkout without forced registration, place visible trust signals and reduce the number of form elements. For checkout design, Baymard puts the average conversion uplift potential of large stores at 35.26 percent [2]; extrapolated to combined US and EU revenue, that corresponds to around 260 billion US dollars in recoverable order volume. This value was determined on large stores such as Walmart, Amazon, Wayfair and ASOS and is a potential, not a guaranteed effect for every store.
The length of the checkout is also measurable: an average checkout displays 23.48 form elements by default [2], of which 14.88 are pure input fields, while an ideal checkout manages with 12 to 14 elements. For most checkouts, a reduction of 20 to 60 percent of the displayed elements is possible without changing anything about the store system itself.
Common misconception: 70 percent cart abandonment means 70 percent is fixable. Only part of it is; the goal is to reduce this friction, because an abandonment rate of zero is not achievable.
These figures come from a US panel with self-reporting and multiple answers, which is why the sum exceeds 100 percent; transferring them to the German-speaking region is plausible, but not one-to-one.
Load time: why every tenth of a second counts
Just 0.1 seconds faster mobile load time was associated with measurably higher conversions in a study by Google and Deloitte. In retail, conversions rose by 8.4 percent and the average order value by 9.2 percent; in travel, conversions rose by 10.1 percent [3]. Load time is a lever that works through images, scripts and server response.
A related measurement framework is Core Web Vitals, Google’s metrics for load time, interactivity and visual stability of a page. The values cited come from a four-week observational study from 2020 with mobile data from retail, travel and other sectors in Europe and the US; they show a correlation, not a proven cause-and-effect relationship.
Mobile optimization: where most volume and the biggest gap sit
Around three quarters of sessions in the Dynamic Yield panel come from mobile devices. The mobile conversion rate, at 2.8 percent, is below desktop at 3.2 percent; mobile sessions therefore lead to purchases less often. That is where volume is highest and the gap between visit and purchase is biggest, which makes mobile optimization a lever in its own right. Typical starting points are shorter forms, sufficiently large tap targets and a checkout streamlined for small screens.
Trust and payment methods: small signals, quantifiable effect
Two abandonment reasons from the table above are pure trust and payment questions: lack of trust when entering credit card details (19 percent) and too few payment methods (10 percent). Visible security, well-known trust seals and a sufficient selection of common payment methods address exactly this.
Test instead of guess: when an A/B test actually proves something
An A/B test only proves an improvement if it runs long enough to reach a sufficient sample size. In an A/B test, two variants, the unchanged original A and the change B, are measured in the same period on randomly split visitors. The random split and the identical period are the core, because otherwise other influences such as seasonality or campaigns distort the result.
What matters is statistical significance, the measure of how certain it is that a result did not arise by chance. Values below 95 percent confidence are usually considered not reliable [4]. If a test is stopped too early, before the required sample size is reached, the risk of a false winner rises, in statistics a type I error [5]. The sample size describes how many visitors and conversions a test needs to separate a real difference from chance.
Common misconception: Variant B won, so it gets built. Without a sufficient sample and statistical significance, repeating the test can produce a different result. First the statistical proof, then the rollout.
CRO is iterative: a hypothesis is followed by a test, then the measurement, then the next test. That individual tests show no effect is normal. Small stores reach the required significance more slowly because they lack the traffic and conversions in a short time.
From practice: the temptation to stop a test at the first good interim result is strong, especially when the variant is finally ahead. That is exactly when false conclusions are most likely.
Does it pay off? What one percentage point more conversion moves
The relationship between conversion rate and revenue can be captured as a simple formula with constant traffic:
Revenue ≈ visitors × conversion rate × average order value (AOV)
The average order value (AOV) is revenue divided by the number of orders.
A calculation example with hypothetical values, not a measurement: if the conversion rate rises from 2 to 2.4 percent with constant traffic and the same order value, that is arithmetically 20 percent more revenue. Since traffic and thus a large part of the advertising costs stay the same, this additional revenue falls disproportionately into the margin: the cost of acquiring the visitors does not grow with it.
Common misconception: More conversion comes from more traffic. CRO works with the same traffic, by converting a larger share of visitors into buyers.
CRO or more advertising? When which path carries
CRO and more advertising both increase revenue, but in different ways. In many cases CRO is the more cost-effective first step, provided the measurement is right.
Two axes are relevant for the decision:
| Decision | One side | The other side | What matters |
|---|---|---|---|
| Growth source | CRO: higher close rate on existing traffic | More advertising: additional, tendentially more expensive new traffic | Effect on margin and return on ad spend |
| Decision basis | CRO: tested changes with statistical proof | Advertising: budget increases often based on gut feeling | Reliability of the decision |
How Dometrics approaches conversion optimization
Dometrics treats conversion optimization as part of a system of tracking, store technology and customer retention. The company sees itself as a technological partner whose five services (tracking, paid, SEO/AI, conversion and retention) work together as modules. The conversion module aims to get more revenue out of the same traffic, because every percentage point more conversion rate makes paid advertising and SEO more profitable.
In eCommerce, Dometrics combines Shopify development, email automation via Klaviyo (see the guide to Klaviyo flows in eCommerce), conversion rate optimization and increasing customer lifetime value, the total value of a customer across all their purchases. The order follows the measurement logic: first secure the data foundation server-side, then test the proven levers in the existing store.
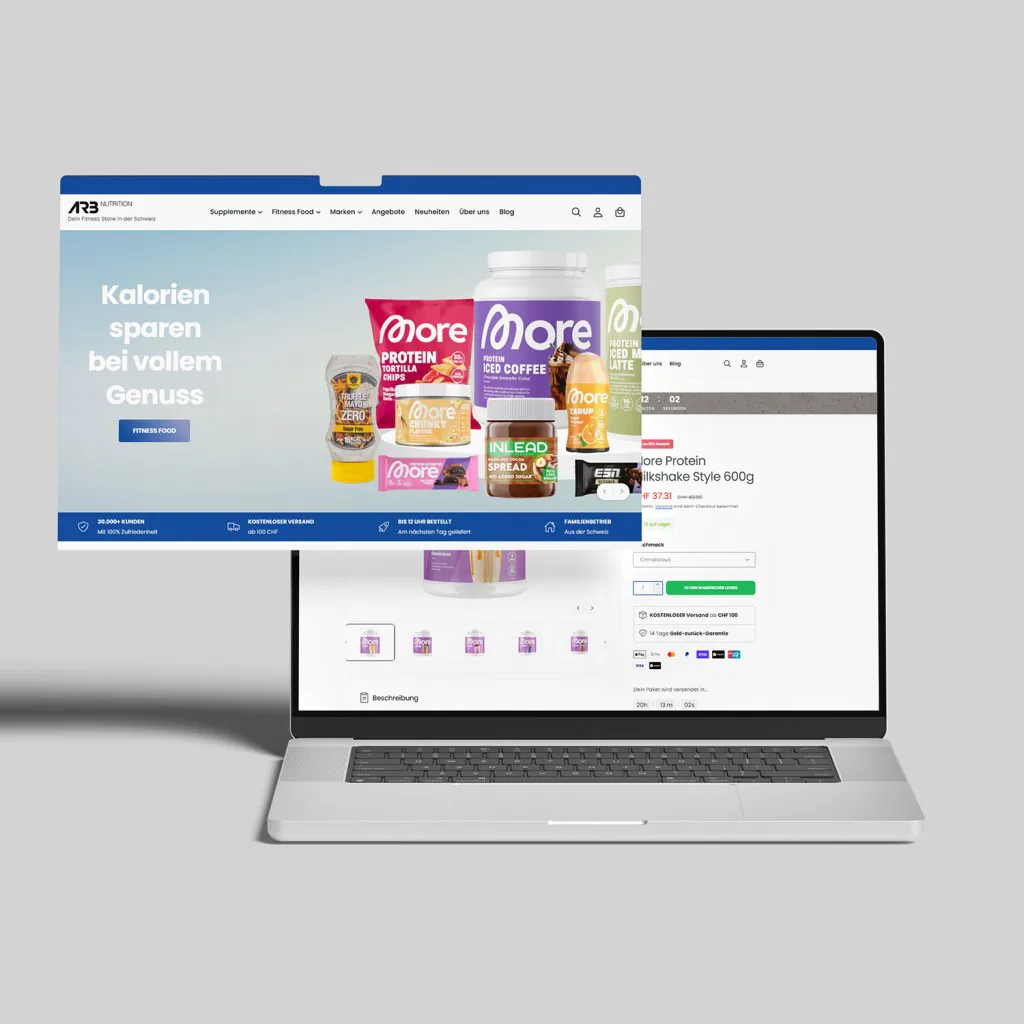
What that looks like in practice is shown by the case of ARB Nutrition, a supplement brand from Switzerland and Liechtenstein. There, revenue rose by 24 percent, return on ad spend improved from 3.1 in December to 8.0 in May, cart abandonment in the checkout fell by 3.7 percent, and tracking coverage was 100 percent server-side [6]. Return on ad spend (ROAS) describes revenue per advertising euro spent. This individual case is not a transferable promise of results for other stores.
More on this: eCommerce and CRO at Dometrics at a glance
The first step: the Growth Report
The Growth Report is a paid data check: it shows which lever lies dormant in the store and gives a yes or no recommendation on whether a collaboration pays off. It costs a one-time 490 euros, and the result is ready after five working days. If Dometrics finds no lever, a clear no follows, and the fee is refunded; if a collaboration follows, the fee is credited 100 percent towards the next phase. This is followed by the build at a fixed price of 3,900 euros over 90 days; ongoing operations start at 2,400 euros per month with a quarterly commitment.
In the end it comes down to a simple question: how much revenue is already sitting in the store today, revenue that targeted changes can capture? The first step there is not a fundamental decision, but a measurement.
Check your CRO potential: Request a Growth Report
Look up terms: Conversion rate · Conversion rate optimization · A/B test · Return on ad spend · Server-side tracking · Cart abandonment · Core Web Vitals · Customer lifetime value · all terms in the Dometrics glossary
Frequently asked questions
What counts as a good conversion rate in an online store?
The global average is around 2 to 3 percent; the Dynamic Yield panel reports 2.9 percent overall. What counts as good depends on industry, device and product range; a single value is only a reference point.
How do I calculate the conversion rate?
Divide the number of conversions by the number of sessions and multiply by 100. 40 purchases from 2,000 sessions equal 2 percent. Pay attention to whether you base the figure on sessions or on individual visitors, because that changes the value.
Why do so many shoppers abandon their purchase?
Around 70 percent of carts are abandoned. 43 percent of surveyed online shoppers abandoned a cart because they were only browsing. The fixable reasons at checkout are above all extra costs that are too high (39 percent), forced account creation and lack of trust (19 percent each), and a checkout that is too long (18 percent).
How do I reduce cart abandonment in the checkout?
Show total costs early and transparently, offer a guest checkout without forced registration, place visible trust signals and shorten the checkout. An average checkout displays 23.48 form elements, while 12 to 14 are sufficient; a reduction of 20 to 60 percent of the elements is usually possible.
How long does an A/B test have to run?
Until the required sample size is reached and the result is statistically significant, usually from 95 percent confidence. A test stopped too early increases the risk of a false winner. Small stores need longer because they lack traffic and conversions in a short time.
Does load time really affect revenue?
In the Google/Deloitte study, a 0.1 second faster mobile load time was associated with 8.4 percent more conversions and a 9.2 percent higher order value in retail. This is a correlation from 2020, not a proven cause-and-effect relationship.
Is CRO worth it, or should I run more ads?
CRO gets more out of existing traffic, while more advertising buys more expensive new traffic. Since traffic stays the same with CRO, the additional revenue falls disproportionately into the margin. The prerequisite is reliable measurement, without which success cannot be proven.
Sources
- [1] Smart Insights – E-commerce conversion rate benchmarks (2025), citing Dynamic Yield (Mastercard)
- [2] Baymard Institute – 50 Cart Abandonment Rate Statistics
- [3] Deloitte (with Google) – Milliseconds Make Millions (2020)
- [4] Convert.com – Statistical Significance in A/B Testing
- [5] Analytics-Toolkit – False Positive Risk in A/B Testing (2023)
- [6] Dometrics: ARB Nutrition case study